In AI infrastructure, the GPU residual value, or resale price, impacts every lease, loan, and equity return, collectively influencing the flow of trillions of dollars, yet misconceptions are too dangerous to ignore.
Key Takeaways
- ➔GPU financing is a young asset class: investors only began underwriting the GPUs separately from datacenter transactions in 2023. As a result, GPU residual expertise is still developing across asset management teams at private credit, equipment finance, and private equity firms.
- ➔As capital and speculation pour into GPU financing, we believe misconceptions around residual value have become too dangerous to ignore. The closest precedent is IBM mainframes in the 1970s. Lessors who booked aggressive residuals went bankrupt within months of IBM's price cuts.
- ➔GPUs are a rapidly evolving technology, more volatile than the assets that lenders typically underwrite. The volatility means traditional methods for modeling residuals can fall short. The most tempting, and the most hazardous, is curve-fitting. Fitting a curve to sparse data points invites overbooked residuals and unnecessary losses.
- ➔Instead of predicted depreciation curves, we are publishing residual bands. Alongside these bands, we rank five potential adverse events: NVIDIA margin compression (high), AI bubble pop (high), bullwhip over-ordering (medium), hyperscaler refresh waves (medium), and technology obsolescence (low).
- ➔It is our belief that GPU residuals are underwritable. We have transaction data covering over 600,000 secondary-market units and run rigorous scenario analysis with actuarial firms and leading reinsurers.
- ➔We believe a GPU's useful life can reach eight years, well beyond the typical financing term. We also believe investors and lenders can book meaningful residuals, even north of 10% of equipment cost over five years. But extreme caution should be used, as the downside from overbooking residuals is severe.
I. Why Residual Value Is the Number That Matters
What Is a Residual?
The residual is most broadly defined as “the resale value of the equipment as a percentage of its original cost.” In practice, residuals let lenders confidently take high-value GPU servers as collateral. They put a number on worst-case recovery in a default, and they give equity investors and lessors a path to higher IRR. Typical commercial lending works the other way, resting on the full faith and credit of the borrowing enterprise (or the end equipment user, the “offtaker”) for repayment.
Most lenders agree that over a three-year term a GPU server should fetch more than 5% of original cost; the debate is whether the right number is 10% or 60%.
Three Lenses on One Number
For the lender, the residual is used as the worst case: it sets the advance rate and the recovery math. A lender only loses when both a default and a weak resale market arrive together. The residual never comes into play if there is never a default. But it still needs to be conservatively booked, because defaults and weak resale markets are strongly correlated. And a deal priced off of the equity investor's target residual is mispriced for the lender.
For the lessor, the residual is a necessary ingredient in every single transaction. The lessor books a residual into the FMV lease on day one and must turn it into cash at the end of the term, by selling or re-leasing the equipment; a weak market alone produces a loss. That is why overbooked residuals have historically killed lessors first.
For the equity investor, the residual is additional upside: how much could the hardware sell for in a strong market, and boost IRR. An overbooked residual costs equity a weaker return, not a hole in the balance sheet. The residual is optional, but can take an IRR from roughly 20% to 35%.
II. The Overbooking Trap
Overbooking, or booking a residual higher than it is worth, is common during speculative periods. A high residual prices the lease lower, lets the loan advance more, and lets IRR projections seem higher. But when the market cools off, reality can deliver a harsh surprise.
The Curve Illusion
Curves are a common cause for overbooked residuals. Curves assume that historical performance predicts future outcomes, which the market routinely proves wrong.
The IBM Precedent
In 1979, IBM cut its own pricing on its newest mainframes due to mounting competition and an “overly healthy” secondary market. It wanted companies to buy new IBM, not secondhand IBM.
Its new mainframe was four times the hardware performance per dollar of the machines it replaced, and IBM's published entry price, the price of the entry level mainframe from IBM, fell from $233,900 to $71,650, a 69% reset in a single announcement. The used market repriced immediately. Losses ran into the billions in today's dollars.
In 1979, IBM held roughly 70% of the computer market, with margins wide enough to fund a price cut whenever competition demanded one. In 2026 NVIDIA ships roughly 90% of datacenter GPUs, at above 70% gross margin. One IBM decision repriced every used mainframe on earth. NVIDIA could decide to do the same if pressured.
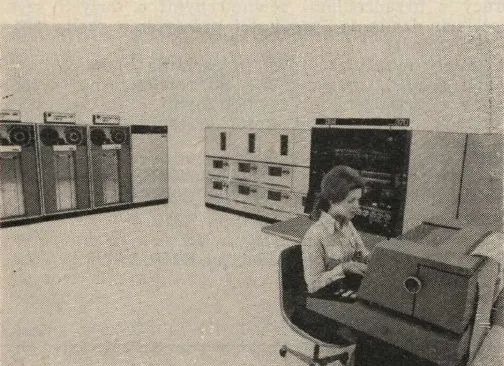

If ever there was a classic American success story, William T. Evans Jr. was it. He joined the Navy in 1965 and learned virtually every aspect of data processing. When he was discharged, Evans went to work for a series of big computer makers — RCA, Electronic Memories and Magnetics, and Telex — and soon enough the ambitious young veteran became a supersalesman.
III. The Residual Bands
We publish GPU residuals as three bands rather than a single curve.
- The conservative band is the safe and reliable scenario.
- The moderate band is aggressive but potentially defensible.
- The dangerous band is very unlikely, bookable only when everything goes right.
Source: The bands are built from a subset of American Compute's proprietary dataset. The full dataset includes 76,775 completed secondary-market transactions, covering 622,098 units across 679 components, collected continuously since 2023. The GPU bands draw on datacenter training GPUs, Pascal through Hopper; consumer cards are excluded. We use arm's-length sales only: no asking prices, no rental rates, no appraisal indices. The residual is measured against original MSRP, after outliers are trimmed. This is used to project out distributions from the GPU release date, which are adjusted further based on specific technology considerations such as memory, power efficiency, and more.
IV. Scenario Modeling: Five Adverse Events
We rank five adverse events: NVIDIA margin compression (high), AI bubble pop (high), bullwhip over-ordering (medium), hyperscaler refresh waves (medium), and technology obsolescence (low). Two of them can break the moderate band, and potentially even the conservative band.
For each event, we name the mechanism that impacts used prices and the leading indicators we watch for it.
1. NVIDIA margin compression (High): NVIDIA is the most valuable public company in the world today, and its gross margin runs above 70%. All eyes are on NVIDIA, and customers are recognizing the dependency as a risk, and actively funding billions into alternatives. That margin, combined with mounting pressure, sets up NVIDIA to take the same steps that IBM did in 1979: drop prices to retain market share.
| Vendor & accelerator | Latest | Capabilities |
|---|---|---|
Google Trillium · Ironwood (TPU v7) | 2025 | Ironwood matches Blackwell per chip and scales to 9,216-chip pods |
AWS Trainium2 · Trainium3 | 2026 | Trainium3 now generally available; AWS claims ~50% lower cost than comparable NVIDIA |
AMD MI355X · MI400 (MI455X) | 2026 | MI400 series and Helios rack land in 2026; 432 GB HBM4, OpenAI and Meta committed |
Microsoft Maia 200 | 2026 | Maia 200 live on Azure; FP4/FP8 inference serving GPT-5.2, ~30% better perf per dollar |
Huawei Ascend 910C · 950 | 2026 | Ascend 950 now sits between H100 and H200; default training silicon inside China |
Intel Gaudi3 · Crescent Island | 2026 | Gaudi line winding down; Crescent Island inference GPU (160 GB) in trials H2 2026 |
Cerebras WSE-3 | 2024 | Fastest published inference tokens-per-second; serves Mistral and Perplexity |
SambaNova SN40L | 2023 | High-token-rate inference cloud on Llama-class models |
2. Technology obsolescence (Low): Prior-generation GPUs keep producing economic value through a use-case ladder: training, inference, fine-tuning, edge, etc. At the same time, new generations have power, cooling, and software friction that slow down adoption. While there's risk of new technologies like photonics leapfrogging current silicon, it's unlikely to be developed, scaled, and adopted quickly enough within the next few years to depress residuals. New generations always arrive late. Announcing a chip is easy, but ramping a new design's supply chain is hard.
3. Bullwhip over-ordering (Medium): The industry ordered through a shortage, and likely over-ordered. Double-orders placed to secure allocation sit in order books and channel inventory, and they surface as supply at exactly the moment demand normalizes (Exhibit 11).
“When suppliers are unable to fill orders, delivery delays increase and customers receive less than they desire. Customers often respond by seeking larger safety stocks (hoarding) and by ordering more than they need to meet demand (phantom ordering).” (Sterman & Dogan)
4. Hyperscaler refresh (Medium): AWS, Google, and Microsoft hoard the largest GPU fleets ever assembled, and they refresh on their own cadence. A single refresh event could release billions of dollars of used hardware into the secondary market at once, depressing prices. A default event at the same time as a hyperscaler refresh would lead to a lower residual than expected. We rank it medium because it would at most cause a temporary drawdown, but it is very unpredictable when it could happen.
5. AI demand pop (High): The demand-side temporarily breaks. A 2026 enterprise survey from Cast AI put GPU utilization at 5% across thousands of enterprises. This is a sign that enterprises haven't fully adopted their own AI, and are still relying on AI assistants from frontier labs like Claude, ChatGPT, and similar subscriptions. If compute pauses because of the lack of utilization, the residuals for unwanted equipment could be very low.
V. The Market Today
The GPU shortage is over. Lead times are back to normal for new orders. What is scarce in mid-2026 is everything around the GPU: grid interconnection, datacenter shells, memory, and storage. This had led to a temporary increase in residuals of older generation equipment like the H100s. These GPUs can still be run on older data centers without liquid cooling or higher power. Because of this, it's actually easier to buy new B200s than used H100s in 2026.
Most GPU financing is done over 36 months, with some deal terms as short as 24 months and others up to 60 months. The asset's economic life should exceed any of these periods, as long as the equipment was first deployed early into the release cycle. Interestingly, the graph below shows NVIDIA speeding up their release cycle and potentially shortening asset life.
The collateral is a server, not a chip. GPUs are roughly three-quarters of a flagship system's bill of materials. Memory retains surprisingly well; CPUs, storage, and networking fall into the teens or lower. Underwriting the GPU residual is a priority, as it is both the bulk of the bill and the bulk of the residual.
The Power and Cooling Wall
GPU systems are becoming more efficient. SemiAnalysis's InferenceX benchmarks put a B200 at roughly three times the tokens per watt of an H200. But each GPU generation requires far more power and cooling than the last (Exhibit 14). An H100 rack runs near 40 kilowatts, a GB200 NVL72 draws roughly 120, and a 2027 Rubin rack is designed for as much as 600.
It is power density that decides which datacenters can host a system. Past roughly 40 kilowatts per rack, air cooling stops working and direct-to-chip liquid cooling becomes mandatory. That confines the newest systems to a small set of purpose-built, liquid-cooled datacenters with the grid capacity, reinforced floors and plumbing. The far larger installed base of conventional, air-cooled datacenters would need to be retrofitted to host the latest systems.
So even as faster silicon arrives, the power and cooling wall keeps the prior generation deployable for years, supporting the long economic life behind our residual bands.
Only a limited number of sites will be built on time to host the newest generation of GPUs, and only a limited handful that can adopt Rubins. Very few operators will accept running new silicon at half power or under thermal throttling.
Because of the power and cooling friction, many enterprises will adapt their workloads to continue running on older hardware rather than chasing the latest and greatest. Signs of this can be found in the software layer of the stack. A large body of open-source work is focused on optimizing models to run efficiently on older, and even consumer-grade, GPUs.
Liquid-Cooled Capacity
Outside of the five ranked events, one upcoming systemic shock will be the liquid-cooled, high-density facility buildout. Right now, the shortage of qualified space is holding up air-cooled B200s and H100/H200s. New GPUs are not being bought, because the datacenter facilities cannot support them. Once more datacenter capacity is built out, Hopper residuals will drop much quicker, because Blackwell runs inference far more efficiently per watt.
The current GPU residuals are therefore not even a function of technology obsolescence, but are more heavily influenced by datacenter project delays. Projects are running behind due to grid, transformer, turbine, and switchgear lead times, though that might change within the next 12 months.
Hoppers are unique: they are one of the last widely adopted air-cooled, lower-power GPUs. The residual curve for Hopper will therefore not translate to Blackwells, as Blackwells will not have a datacenter shortage propping up their residuals the way Hoppers do today.
VI. Modeling Pitfalls
1. Indices and rental rates: Rental indices are not good indicators of resale value; rigorous backtesting shows only a weak correlation between the two. Only an arm's-length secondary transaction prices the asset itself. As Exhibit 15 shows, actual secondary transactions refuse to follow the rental line.
2. DCF as the basis: An extension of the rental-rate approach is a discounted cash flow model of what the asset is worth. But DCF models lean heavily on rental rates, which are volatile: market regimes shift and pricing competition grinds on, and that volatility bleeds straight into the analysis. The result is a poor tool for predicting residuals.
3. Overthinking physical wear: Silicon does not wear out the way cars and other hard assets do, and both the primary and secondary markets are protected by robust warranties and third-party maintenance contracts. Most equipment resellers run diagnostics, refurbish, and back second-hand gear with 30-day performance guarantees. Second-hand buyers don't care about a single GPU's thermal history, so neither should primary buyers.
4. Curves instead of distributions: A single curve is a single guess, and it hides the only thing underwriting cares about: dispersion. Our data shows GPUs selling at very different prices in the same period, driven by market conditions, reseller networks, and other variables a curve cannot carry.
5. Consumer vs. enterprise: Review data sources for consumer bias. A single PCIe card on a retail listing site is valuable to a consumer, not to an enterprise. Consumer comps carry gamer demand, hobbyist condition tiers, and retail spreads that have nothing to do with how enterprise systems clear.
6. Depreciation schedule as residuals: Depreciation schedules are tax and reporting conventions, and they fail to predict residuals. A 3-year straight line writes equipment to zero while the market still pays for it; a 6-year schedule can carry book value the market floor no longer supports.
7. Asset age instead of technology age: Residuals should be booked on technology age, measured from the day a GPU generation first reaches buyers, when the first units actually ship and can be deployed, not from the day a particular server was purchased, and not from the day NVIDIA announced the chip (announcements often precede shipments by many months). For example, an H200 bought brand-new today is already more than two years into its technology life, because that generation first shipped in 2024, even though the server itself has never been racked.
8. Overlooking delays: Most smaller operators do not get allocation for flagship GPUs at launch, and projects get delayed for all kinds of logistical reasons; a Blackwell project signed today might only be racked and installed in six months. We see most financing on smaller clusters close on GPUs that are already a year past release.
VII. What Holds Value
Certain qualities can help equipment maintain higher residuals. In general, anything that makes the equipment appeal to a larger pool of buyers will help.
1. OEM brands. Despite containing the same NVIDIA GPU, a server from Dell and one from a Chinese OEM like Gigabyte can have very different resale values. In general, servers from major OEMs like Dell clearly resell for more than those from smaller builders. For instance, our data shows Dell-built servers reselling about 18% above less-known OEMs.
2. Whole vs. parted-out. Second-hand buyers have little interest in piecing together several orders to build a cluster. A whole cluster that has already been tested, configured, and proven to work will sell better than the same nodes sold individually.
3. Vanilla vs. exotic. Standard configurations clear faster and higher than bespoke ones. A vanilla configuration taps into a wider buyer pool and is more likely to find a buyer willing to pay a good price. A highly specific cluster with unusual pooling, networking, or heterogeneous silicon has a much smaller pool.
4. Geography. GPUs deployed in the U.S. resell better than identical units deployed abroad.
5. Documentation. Service records and original configuration documents help. Buyers value more information, though they ultimately lean on the reseller's guarantee that everything works and on the third-party maintenance contract.
6. Timing. It's better to give the resale process room to breathe, ideally 30 to 60 days; a rushed sale fetches a lower residual. It usually takes about 30 days, but can take longer to find the right buyer after preparing remarketing materials, running diagnostics, and refurbishing the equipment.
VIII. Conclusion
GPU residuals will not always follow a curve. The market can change suddenly, with booms and busts that catch the unprepared. And not everyone quoting an overly high residual is being honest with themselves.
We leave the reader with three recommendations:
1. Model in bands, not a curve. Pick a defensible band, not a point. Compare your financial performance at the top and bottom of the range.
2. Pick the band that fits your risk appetite. Lessors should sit at the most conservative end, lenders can be slightly more aggressive, and equity investors can be the most aggressive of all. The biggest danger is every party using the same band. Think T-bills versus stocks: both have their time and place depending on the investor's risk-return profile. No single band is right for an operator, a lender, and an equity investor on the same project.
3. Add confidence where it matters. Beyond the residual value insurance solutions we structure, a few market solutions can backstop or guarantee your underwritten residual. Residual value guarantees from IT asset disposal firms can also help, provided you are comfortable with the counterparty risk. And read the fine print: some products quietly exclude the very event you are worried about, for example by lapsing coverage if an overall GPU index falls past a set threshold.
A limited sample of the dataset behind this paper is available to from this page.
If you would like to discuss structuring residual value insurance solutions for a transaction, need a valuation, or want a second opinion on a residual assumption, contact us at deals@amcompute.com.

Bernie leads American Compute's program business end to end: underwriting, reinsurance capacity, deal structuring, and the carrier and client relationships behind them. Prior to founding American Compute, he was chief of staff at a $2.6B insurance carrier and spent four years at Wavemaker Partners in Singapore investing in technology companies from seed through Series B. He also operates an approved on-shore U.S. captive manager.
Bernie holds the Chartered Property Casualty Underwriter (CPCU) designation, the most prestigious credential in property and casualty insurance. He graduated from Ateneo de Manila University with a BS in Management Engineering.

Illia leads engineering at American Compute and built the data platform behind the firm's underwriting: the collection and processing of the secondary-market transaction data, the pipelines that keep it current, and, together with the firm's actuaries, the rate-making models built on it. He also leads the firm's hardware teardowns and analysis of the ML architectures that drive GPU demand.
Previously, he was a founding engineer at a multi-billion-dollar insurance carrier. Before that, Illia built large-scale fraud detection and content moderation models at Quarks Tech and ML perception systems for defense drones in support of Ukraine. He graduated from Taras Shevchenko National University of Kyiv with a bachelor's degree in Applied Mathematics.

American Compute structures residual value insurance solutions for GPU servers, backstopping residual outcomes for financing parties.
We work with A-rated reinsurers and can structure solutions for transactions up to $500M.
Where needed, we also consult and provide appraisals built on our proprietary datasets.
Contact us at deals@amcompute.com.
This document is provided for informational and educational purposes only and does not constitute an offer of insurance, a quotation, or investment, tax, accounting, or legal advice; it should not be relied upon in making any investment, financing, or underwriting decision. The views and estimates expressed are those of the authors and American Compute Research as of June 2026, are based on sources believed to be reliable but not guaranteed, and are subject to change without notice. Residual bands, scenarios, and other forward-looking statements are estimates, involve known and unknown risks and uncertainties, and may differ materially from actual outcomes; past secondary-market performance does not guarantee future results. Transaction data referenced herein is American Compute proprietary data unless otherwise noted; third-party data is attributed to its source and remains the property of its owners. Insurance products are available only where licensed and approved, and are subject to the terms, conditions, and exclusions of the policies as issued. No part of this document may be reproduced without the prior written consent of American Compute, Inc.